
The ability to analyze new versus returning data is crucial to tailor strategies to both attract new customers and retain existing ones effectively.
New and Returning data are important for tracking growth and efficacy. Your Northbeam dashboard offers two main types:
- New vs. Returning Conversion data (Orders and Revenue)
- New Visit data (Site Visits from New Visitors)
New vs. Returning Conversion data can be used for:
- Optimizing and scaling conversion campaigns
- Tracking business level performance
New Visit data can be used for:
- Monitoring ad fatigue
- Evaluating audience saturation or overlap
What is New vs. Returning Conversion Data?
This refers to any conversion-based metric, broken out between your new and returning customers. Examples include the following:
- 1st time transactions (New Customers)
- CAC 1st time (nCAC, or cost per 1st time customer)
- CAC returning (rCAC, or cost per returning customer)
How do I see New vs. Returning Conversions?
There are a few spots in the dashboard to see your new vs. returning data broken out:
- Overview page
- Sales page
- LTV page
- Orders page
New vs. Returning Conversions in the Overview Page
The Overview page is ideal for seeing new and returning trends. Reference the Revenue chart (bottom, left corner) and see the following metrics:
- Transactions (New vs. Returning)
- Revenue (New vs. Returning)
You’ll see total transactions or revenue by day, broken out by new and returning customers.
New vs. Returning Conversions on the Sales Page
When customizing your metrics, you’ll see all conversion or revenue-based metrics have “1st time” and “returning” versions.
For example:
- Attributed Rev (1st time)
- CAC (1st time)*
- ECR (returning)
*refers to nCAC
💡TIP: Select these metrics and save them as a Saved View so you can easily refer back to them.
New vs. Returning Conversions in the Customer LTV Page
On the Customer LTV page, the “Customers” column refers to first-time customers, regardless of the selected dimension.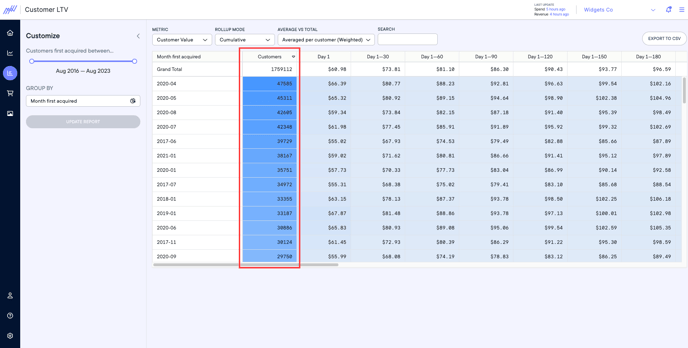
New vs. Returning Conversions in the Orders Page
On the Orders page, use the “Customers Type” field to toggle between New and Returning customers.
What is New Visit Data?
We also provide New visit data. This refers to any new site visitors that our pixel hasn’t recognized. This includes the following:
- New Visits
- CPNV (Cost per New Visit)
How do I see New Visit Data?
- Log in to your Northbeam dashboard
- Navigate to the table under the graph and click Customize Table
- Search for and select Visits and Cost per New Visit (or eCPNV)
These can be used as a secondary metric when optimizing. For example, if your cost per new visit is increasing, it means that you’re attracting new visitors less efficiently. This could indicate any of the following:
- Potential ad fatigue
- Potential audience saturation
- Potential audience overlap
💡TIP: It may make sense to confirm the fatigue or saturation using “Frequency” in your Ads Manager.