
How to navigate and manage your Northbeam dashboard: Your guide for getting started!
Northbeam is a machine learning ad attribution platform powered by multiple attribution models. We collect data using proprietary first-party tracking methods to provide three levels of data: topline, granular, and cross-platform. The result is the most robust insights possible into your customer journey. Our mission is to help you make data-informed decisions so that you can scale your brand profitably.
This platform-walkthrough will show you how to analyze your attribution data to find the marketing channels that drive the biggest impact for your business.
Overview Page
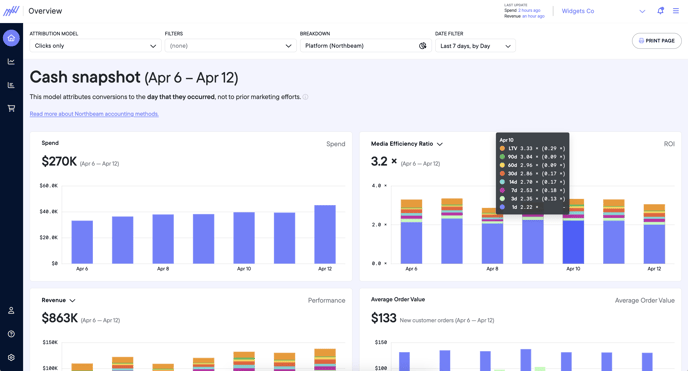
Let’s get started. The first thing you’ll see when you log into Northbeam is the Overview Page. This page provides a high-level summary of your business, and is designed for executives to quickly understand topline metrics and performance. The Overview Page is best used to understand the overall health of your marketing funnel, identify conversion lag, and map out the customer lifecycle.
The Overview Page is broken down into two sections: Cash Snapshot and Accrual Performance.
Cash Snapshot
The Cash Snapshot uses cash-basis accounting and provides information about cash inflows and outflows for the time specified, including Marketing Spend, Media Efficiency Ratio (MER), Revenue, and Average Order Value (AOV).
In this mode, revenue and conversion credit are only given to the single day that the transaction occurs. The Cash Snapshot view is useful for understanding the amount of cash coming in any given day, and is designed for your internal accounting teams to match reporting standards.
Accrual Performance
The Accrual Performance view uses accrual accounting and provides information on change in attributed revenue over time. What does this mean? In Accrual performance conversions are given credit to the day(s) where contributory touchpoints occurred – not only the day that the conversion occurred (like the Cash Snapshot does) – meaning that Accrual Performance is useful for measuring conversion lift and lag.
Breakdown Table
The Breakdown Table for Cash Snapshot and Accrual Performance shows key metrics such as spend, MER/ROAS, CAC, and Visits all categorized by platform. We recommend that you review these tables weekly to get a quantitative view to complement the trendlines found in the charts.
💡TIP: Use the dropdown menu to choose other breakdowns to further segment your data. Updating one breakdown table will also update the other.
Sales Page
The Sales page gives you more metrics than the Overview page, allowing you to create both short and long-term forecasting strategies. At the top of the page you’ll find several options to view your data.
- You can start by either selecting a preferred Saved View or select which Attribution Model, Attribution Window, Accounting Mode, and Time Period to use.
- Breakdowns allows you to further segment your data by Ad Type, Ad Concept, Platform, and more.
- You can use the Breakdown tool to create your own breakdown, such as Platforms, Targeting, Influencers.
- Above the line graph are a list of Key Performance Indicators (KPIs) that will help you quickly decide what you want to dig into further. The percent change insight at the bottom of each box is based on the option you selected in the Time Period filter at the top right of the Sales page.
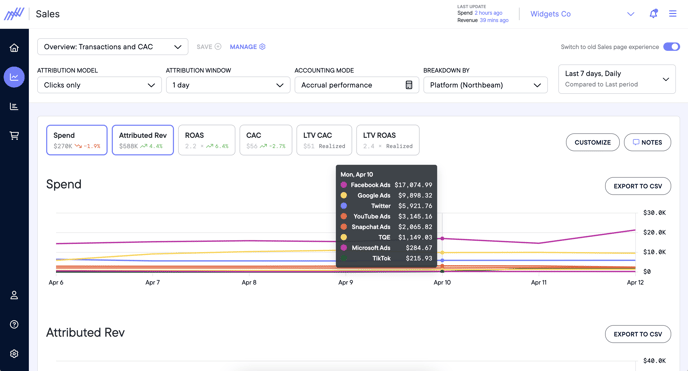
Spend and Attributed Revenue
Spend and Attributed Revenue = The total marketing spend and resulting revenue for a specified time period
- Attributed Revenue is based on the attribution model and window selected–it operates here as it does in the Cash Snapshot and Accrual Performance views on the Overview Page.
- 1 Day refers to the most conservative Attribution Window we offer, but you can change this by choosing another Attribution Window using the toggles at the top of the page.
LTV Attributed Revenue
All touched revenue with no cap on the amount of time between the touchpoint and transaction
The delta between Attributed Revenue (1 Day) and LTV Attributed Revenue is your conversion lift.
ROAS (Return on Ad Spend)
The revenue that is earned for every dollar spent on a marketing campaign
The delta between ROAS (1 Day) and LTV ROAS can be thought of as your Conversion Lag–this delta increases over time as additional conversions are attributed to previous marketing touch points.
Impressions, CTR, Visits, New Visits
Used to determine if marketing campaigns are resonating with customers
- Visits and New Visits are used to monitor the ratio of Visits to New Visits to determine if your ads are generating more new customers or more returning customers and repeat purchases.
eCPC and CPM
These metrics will vary depending on ad costs, but we still recommend tracking in case your costs dramatically increase for any reason.
CAC (Customer Acquisition Cost)
The cost of getting a new customer to purchase a product or service from you
- 1 Day CAC will capture customer acquisition costs related only to transactions that occurred within 24 hours of the marketing touch point.
- LTV CAC will roll up all eventual conversions and show you a “true” CAC dollar figure. We strongly recommend that you regularly look at your CAC to ensure it’s not above a tolerable/profitable level for your business.
Email Signups, Email Signup Rate, Cost per Email Signup
Used to determine if marketing campaigns are generating customer retention and loyalty
These metrics show email performance broken down by whether customers are opting in for email communications, what percentage of customers opt in, and how much it costs you to get a customer to opt in.
💡TIP: Below the metrics section, you’ll see two line graphs. Click on any two metrics you want to compare and they will populate into these graphs.
At the bottom, you’ll find a Breakdown Table that shows all of the metrics mentioned above in a table format. The rows show campaign data and the columns show the respective metric for that campaign. You can select the Breakdown dropdown to sort by platform, category, or targeting.
💡TIP: Sorting by Platform is commonly used to directly compare different ad platforms to determine which platform is performing the most profitably.
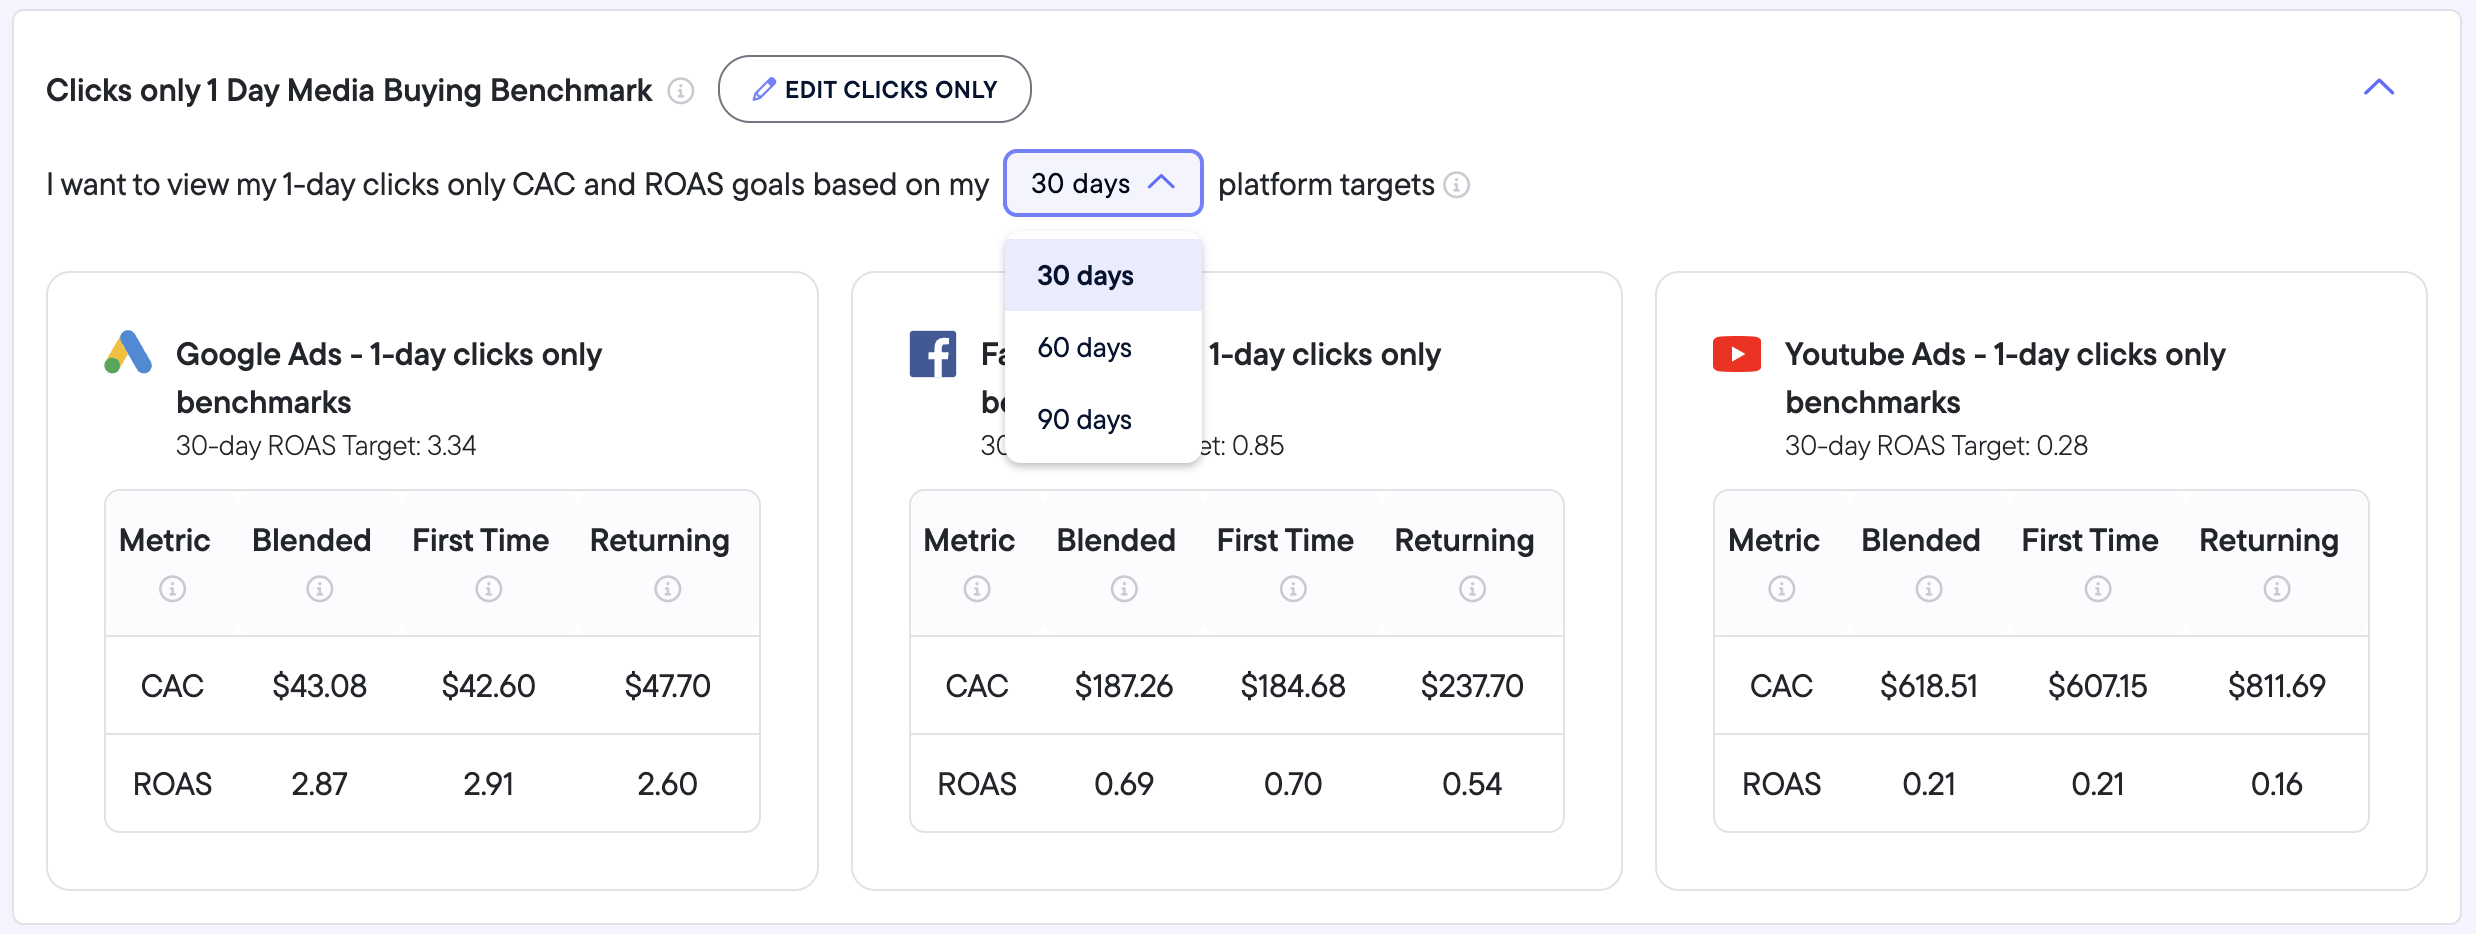 Benchmarks
Northbeam's Benchmarks emulates the performance of the top DTC media buyers. We aim to empower you with the industry standard practice of setting 1-Day benchmarks.
- Learn more about Northbeam's Benchmarks feature here
- Learn how to use setup 1-Day media buying objectives to forecast campaign performance 30, 60, and even 90 days out
LTV Page (Customer Lifetime Value)
The LTV Page helps you keep track of how much revenue your customers are generating throughout their entire lifecycle. Our LTV tool is able to display changes in customer value over any specified time period.
The LTV tool can help you determine which campaign(s) are retaining customers most effectively and efficiently, allowing you to identify which campaigns you should scale and which campaigns you should re-evaluate.
The 7 Breakdowns of Northbeam’s LTV Tool
Once you click on the LTV tab on the left panel, you will be greeted with a Customize Bar and directed to choose a timeframe and by seven breakdowns:
✏️ NOTE: The timeframe scale will populate as far back as you have revenue data.
- Month First Acquired is a chronological month-over-month comparison that identifies high-performing or underperforming months and which campaigns occurred each month.
-
Week First Acquired is a breakout week-by-week basis.
-
Country (Shipping Address of First Order) is the LTV by geography used to inform the ROI on marketing initiatives by country.
-
Region (Shipping Address of First Order) highlights the LTV based on geography and provides the corresponding marketing activities in each region.
-
First Order (Product + Variant) is the first order of the average customer and the percentage of customers that complete repeat purchase orders over the next year. For example, we can see the average customer who purchases Item A and how often and when they buy Item B and Item C.
-
First Order (Product) is similar to First Order (Product + Variant) but helps identify the specific order of purchase.
-
First Order Discount Code highlights all of your discount codes and the lifetime value of customers based on each discount code.
The 3 Metrics of Northbeam’s LTV Tool
The Metric menu determines what values will populate into the blue boxes throughout the table with the default set to Customer Value (CLV).
-
Customer Value (CLV) is the total income your company can expect from a typical customer throughout the lifetime of that relationship.
-
CLV with Refunds assures that your CLV is not artificially inflated by returned or refunded orders.
-
Orders per Customer and % Reordering measures frequency and repeat purchases allowing you to determine the health of your bottom-of-funnel strategies.
💡TIP: If your business is driven largely by recurring or subscription purchases, these two metrics are essential.
Rollup Mode
Rollup Mode refers to how you want to view data in the blue boxes in the table below.
-
Cumulative is the default option and shows you a running total of CLV.
-
Marginal allows you to see when customers may be returning. The Marginal view will show you incremental dollars per month, by default.
-
Cumulative excluding Day 1 is a different way to think about marginal change by showing you the cumulative change after the initial purchase. Cumulative excluding Day 1 keeps a running total of those incremental dollars.
Average vs Total
These views look at the CLV weighted average per customer vs total across all customers.
💡TIP: Total Over All Customers can be used to compare performance across geographies or product lines.
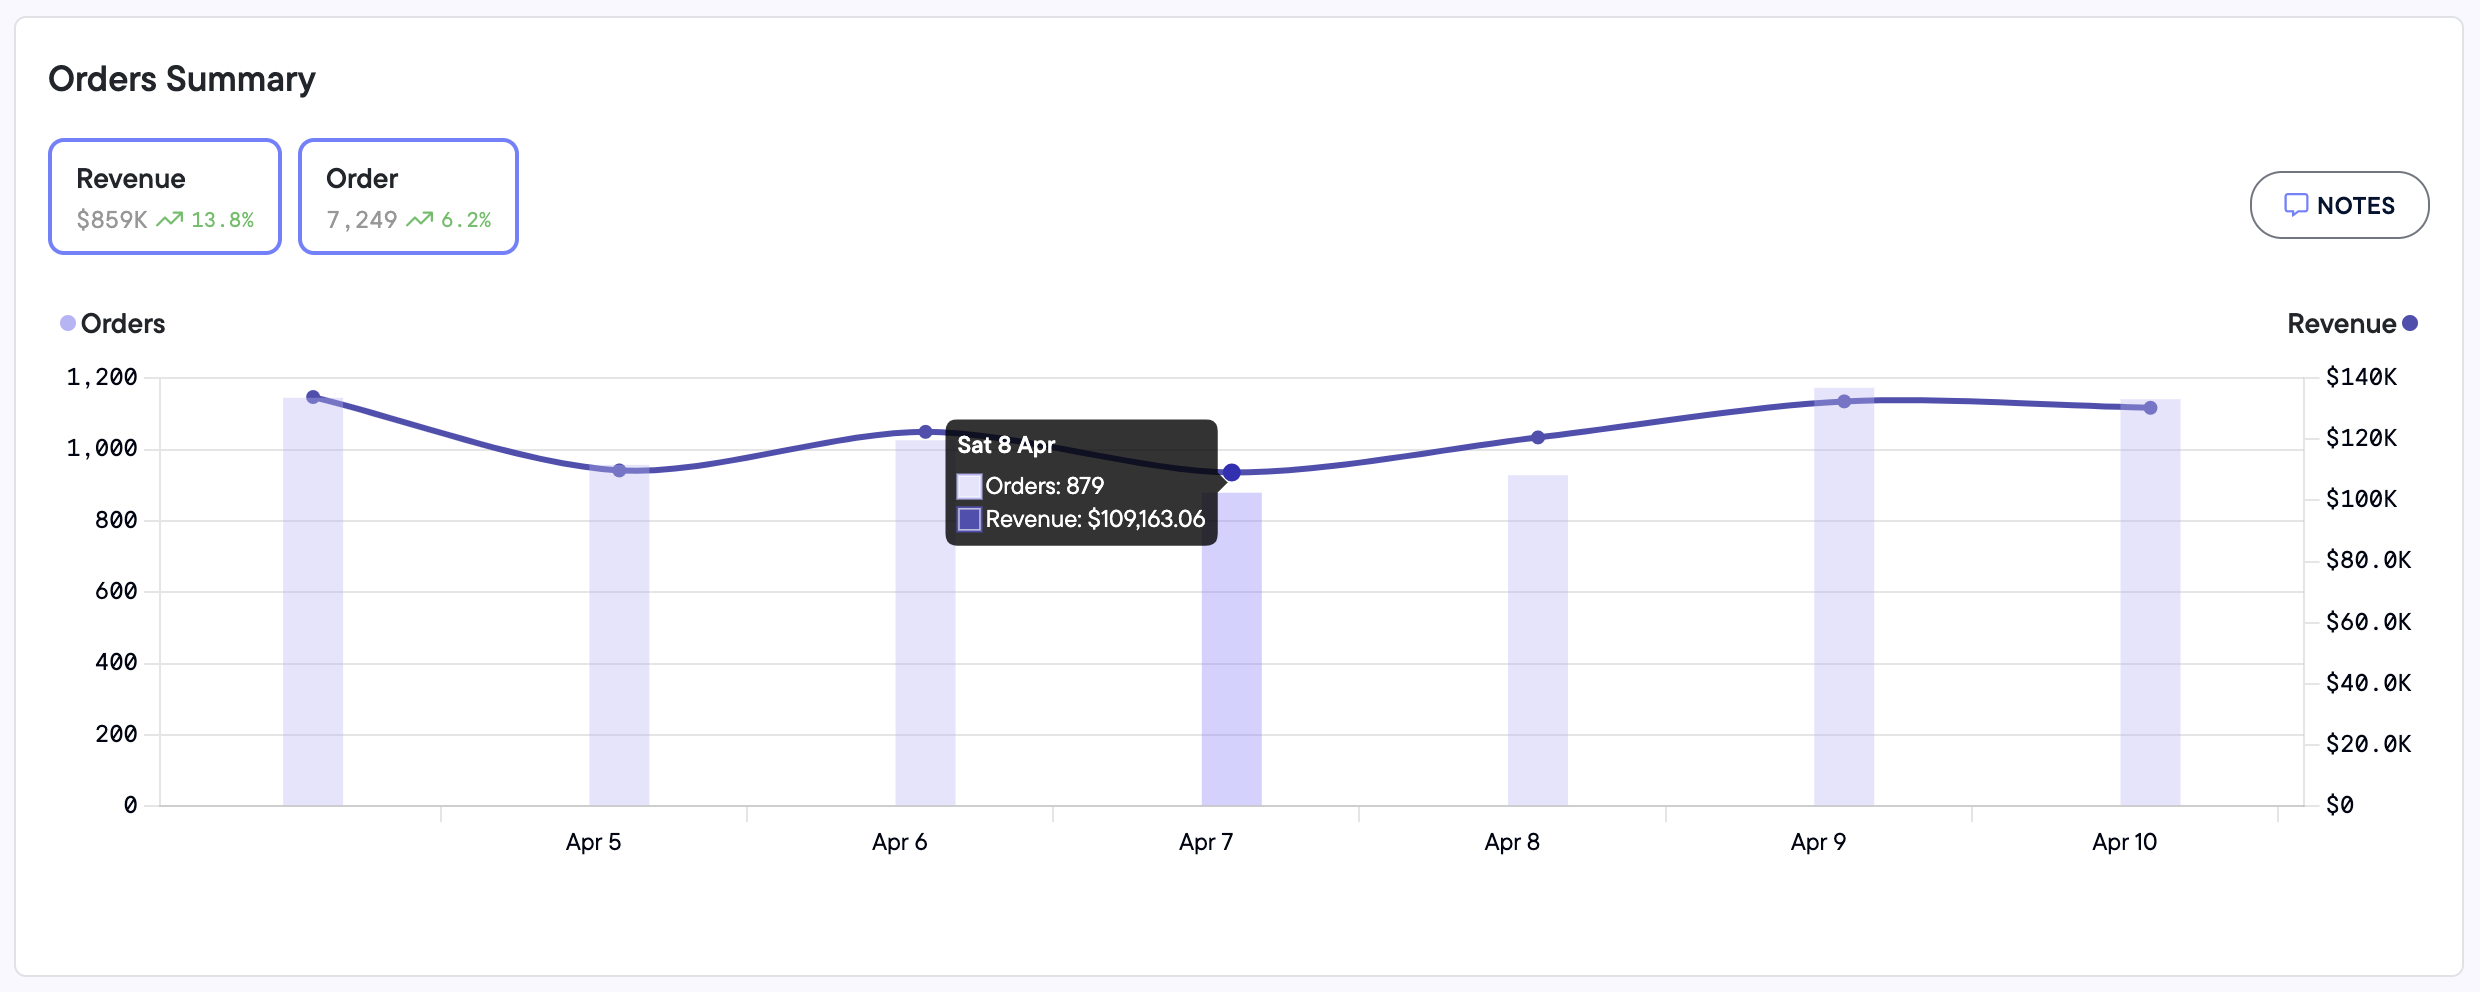
Orders Page
Our Orders page allows you to visualize top-line business performance. To dig deeper, you can use this page to identify which platforms are attributing revenue and orders, directly report on sales, and understand what a typical customer journey looks like and how the media channels intersect.
-
Order Summary highlights which platforms are attributing revenue and orders.
-
Order Details offers transparent, detailed information on each customer’s journey that led to an order.