
When assessing your core marketing metrics, Northbeam offers access to various reports and views tailored to analyze performance. Our Overview page is designed to uncover high-level insights, offering a macro perspective to your business. In contrast, our Sales page is designed to assist media buyers analyze granular campaign performance data enabling you to make informed optimization decisions.
Overview Page
These reports provide a CEO-level perspective of your business. Within these reports, you can review high-level metrics such as spend, revenue, average order value, cost per customer, and more. Additionally, these metrics are presented with trend analysis over time, providing an easy assessment of the conversion lag within your business.
💡TIP: You have the flexibility to switch between our attribution models, including Cash and Accrual. Cash accounting, in particular, is well-suited for executives and aligns with the reporting preferences of most CFOs.
This page is valuable for examining macro trends within the business and uncovering key insights, such as:
-
Why our AOV is trending upward when we just launched a sale?
-
Why is our MER so high in January, should we maintain this marketing mix
This page is designed to assist you in monitoring the business from a top-down perspective and staying on top of your market trends.
Sales Page
The Sales page is tailored for more granular reporting and in-depth trend analysis. It's where our power users who thrive in detailed analytics spend the majority of their time in the dashboard. This page features a chart builder and a data table, allowing you to construct custom reports and graphs by leveraging:
💡TIP: Once you've created the ideal report tailored to your business needs, you have the option to save it for future use.
✏️ NOTE: Breakdown labels enable you to categorize, group, and filter data within the Northbeam platform. This functionality proves very beneficial, particularly for A/B testing and generating personalized reports.
You can also set up Benchmarks, which allow you to set and plan against KPI/profitability goals.
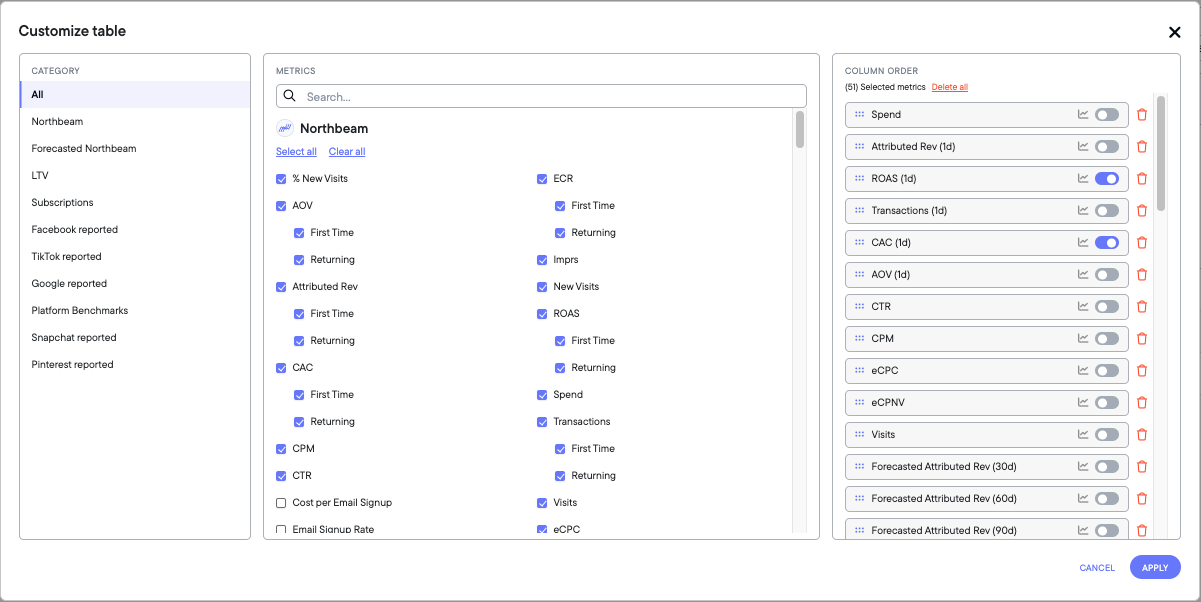
The Sales page is rich in data, allowing you to include nearly any metric in your report. You can even incorporate in-platform metrics, such as Facebook-reported performance.
Here are some questions that users might address when utilizing the Sales page:
-
How is my Facebook spend is driving Amazon Revenue?
-
How are my campaigns performing compared to this time last year?
-
How are my new creatives are performing in different GEOs/Markets?
These questions serve as valuable guidance for users, aiding them in extracting meaningful insights and making informed decisions while analyzing data on the Sales page.